OHBM 2021 ANNUAL MEETING
AUTHORS: Agnès Pérez-Millan, José Contador, Adrià Tort, Sergi Borrego-Écija, Beatriz Bosch, Mircea Balasa, Bàrbara Segura, Gemma Monté-Rubio, Núria Bargalló, Albert Lladó, Raquel Sanchez-Valle, Roser Sala-Llonch.
TITLE: Studying the effect of scanner change on measures of gray matter for Alzheimer’s disease studies.
CONFERENCE: OHBM 2021 ANNUAL MEETING
PLACE: Virtual Event
DATES: June 21 - 25, 2021
ABSTRACT:
INTRODUCTION: Longitudinal magnetic resonance imaging (MRI) studies allow the study of brain biomarkers during the course of neurological disorders such as Alzheimer’s disease (AD). During the course of these studies, scanner changes may contribute to the reliability of MRI-derived metrics. Here we aim to study the effects of changing from a 3T-Siemens Trio Trim (scanner 1) to a 3T-Siemens Prisma (scanner 2) on gray matter (GM) measures obtained from T1-weighted acquisitions.
METHODS: We studied 3 MRI-longitudinal datasets with 2 time points separated 2 years, all having available T1-weighted scans, with equal or equivalent acquisition protocols: A group of 14 healthy controls scanned with scanner 1 (CTR, median age [interquartile range, IQR] = 58.4 [54.7, 61.4] years); a group of 17 healthy controls, scanned at baseline with scanner 1 and after 2 years with scanner 2 (CTRc, median age [IQR] = 59.7 [49.0, 60.9]), and a group of 12 AD patients, scanned with scanner 1 (AD, median age [IQR] = 60.4 [58.0, 65.8]). All AD patients showed pathological levels of core CSF biomarkers (A+ T+) with neurodegeneration (N+), while all CTR subjects were within the normal biomarker range (NIA-AA 2018). We used cross-sectional and longitudinal processing streams of FreeSurfer to obtain summary measures, including subcortical GM volume, cortical thickness (CTh), cortical surface area and cortical GM volume, using available atlas of cortical parcellations and subcortical segmentations. We studied the intra-class correlation coefficient (ICC) to assess the reliability of the metrics for CTR and CTRc groups. We calculated the percent difference (PcD) to obtain the relative difference of GM measures between timepoints, for all groups. With the PcD measure, we aimed to study the magnitude of the changes due to the scanner in comparison with the effect of AD atrophy. We further focused on hippocampal atrophy, as it is considered a biomarker for AD.
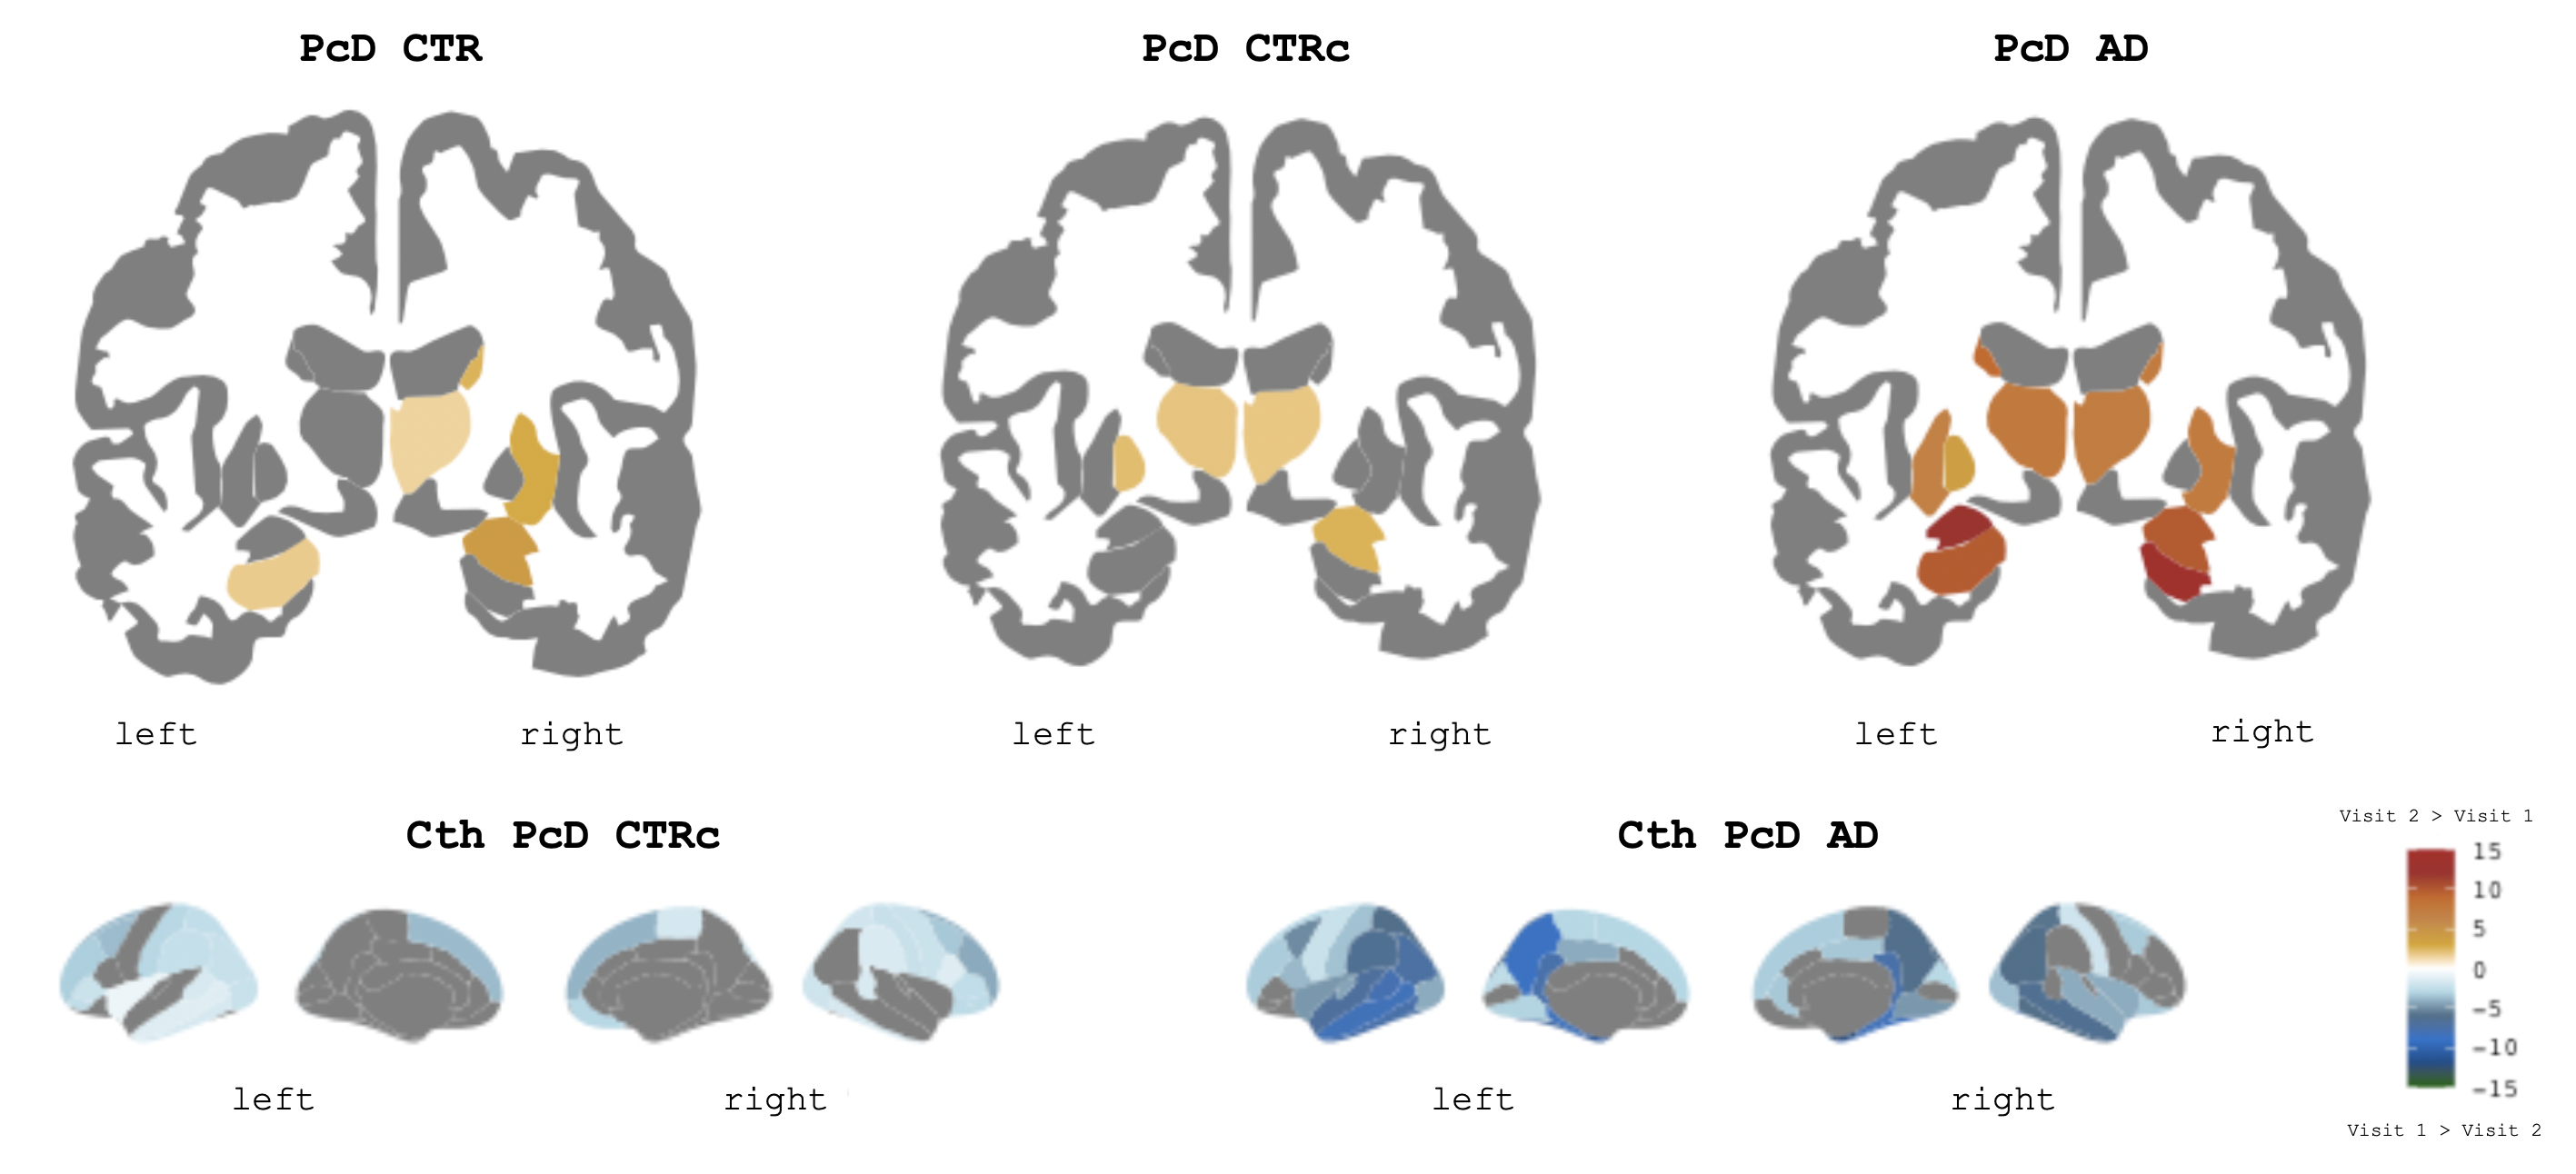
RESULTS: There were no differences in age and in time between acquisitions among the three datasets. When studying ICC in CTR and CTRc, we found that the longitudinal FreeSurfer stream provided higher mean ICC values. Of all the measures studied, ROI-CTh were the most affected by scanner change, with a mean across regions of 0.8 and 0.92 for the CTRc and CTR groups respectively (36 out of 68 regions were significantly different). We found differences between the CTR and CTRc groups in 16/68 regions surface area and 20/68 or the GM volume. However, mean ICC values were nearly 1 for both datasets for these metrics, indicating good reliability. As regards PcD, we consistently observed that longitudinal differences were stronger in AD than in CTR or CTRc groups (Figure 1). Mean PcD values for CTh (across parcellations) were: -0.20% for CTR, -1.53% for CTRc and -4.57% for AD. And mean PcD for subcortical GM volumes were (across atlas regions): -3.11% for CTR, -2.76% for CTRc and -10% for AD. Hippocampal atrophy was similar between CTR and CTRc with values nearly zero with no significant differences between them. In AD, hippocampal volume loss was stronger, showing significant differences with CTR and CTRc (Figure 2).
CONCLUSIONS: We provide an analysis of longitudinal GM measures derived from T1-weighted MRI scans on 3 different datasets, accounting for scanner changes and AD progression. In general, we found small test-retest changes and high reproducibility rates in healthy controls when analyzed with the Freesurfer longitudinal stream, even when changing scanner. CTh was the most affected measure (although showing ICC nearly 1) by scanner changes, suggesting that further approaches could improve this measure. In AD, we found high rates of changes in comparison with both the CTR and CTRc groups, suggesting that the change of scanner is not a handicap in order to identify pathological brain processes in T1-weigthed data.