OHBM 2022 ANNUAL MEETING
AUTHORS: Agnès Pérez-Millan, José Contador, Neus Falgàs, Núria Bargalló, Mircea Balasa, Albert Lladó, Raquel Sanchez-Valle, Roser Sala-Llonch.
TITLE: Prognosis of Alzheimer’s Disease and Frontotemporal Dementia with a brain age model.
CONFERENCE: OHBM 2022 ANNUAL MEETING
PLACE: Glasgow, United Kingdom
DATES: June 19 - 23, 2022
ABSTRACT:
Introduction: Alzheimer Disease (AD) and Frontotemporal Dementia (FTD) are common forms of dementia, characterized by progressive brain atrophy at variable rates along the age continuum. Neuroimaging studies with magnetic resonance imaging (MRI) have showed that distinct brain atrophy patterns could potentially help in differentiating both diseases (Falgàs, 2020). Here, we introduce a framework for modelling and predicting the evolution of both dementias using region-wise Cortical Thickness (CTh) measures obtained from cross- sectional and longitudinal MRI scans.
Methods: We included cross-sectional 3T-T1w MRI data of 322 subjects: 91 healthy controls (CTR, age: 62.2 ± 8.1 years), 82 Early Onset AD patients (EOAD, age: 58.0 ± 4.7 years), 63 Late Onset AD patients (LOAD, age: 72.3 ± 4.5 years) and 86 FTD patients (FTD, age: 63.3 ± 8.1 years). We also included longitudinal data (2 years approximately between visits) of 112 subjects with equal or equivalent acquisition protocols, all of them with a second visit (66 CTR [age: 64.5 ± 6.8 years], 16 EOAD [age: 60.5 ± 3.6 years], 4 LOAD [age: 68.5 ± 0.4 years] and 26 FTD [age: 63.8 ± 5.9 years]), and 43 with a third visit (34 CTR [age: 64.8 ± 5.3 years] and 9 FTD [age: 62.9 ± 4.3 years], patients with longer follow up were younger initially). We obtained regional CTh measures using FreeSurfer. Cross-sectional data was used to obtain models of trajectories separately for each group with Support Vector Regression (SVR). Then, these models were used to predict CTh values for each age-point and each group. We used a cross-validation of 10 to obtain the best parameters for the SVR. Overall, the accuracy of the predictions was assessed using leave one out cross validation approach quantified using root-mean-square error (RMSE). We used the longitudinal data (all the points from the successive visits) as unseen test data and to obtain individual predictions. Finally, we compared these values using the mean absolute error (MAE) for each region: each test subject was compared against its predicted value and against its corresponding baseline subject. For each region, we evaluated whether if the MAE between the baseline data and the longitudinal data was lower/greater than the MAE between the longitudinal point and the age-group predicted subject.
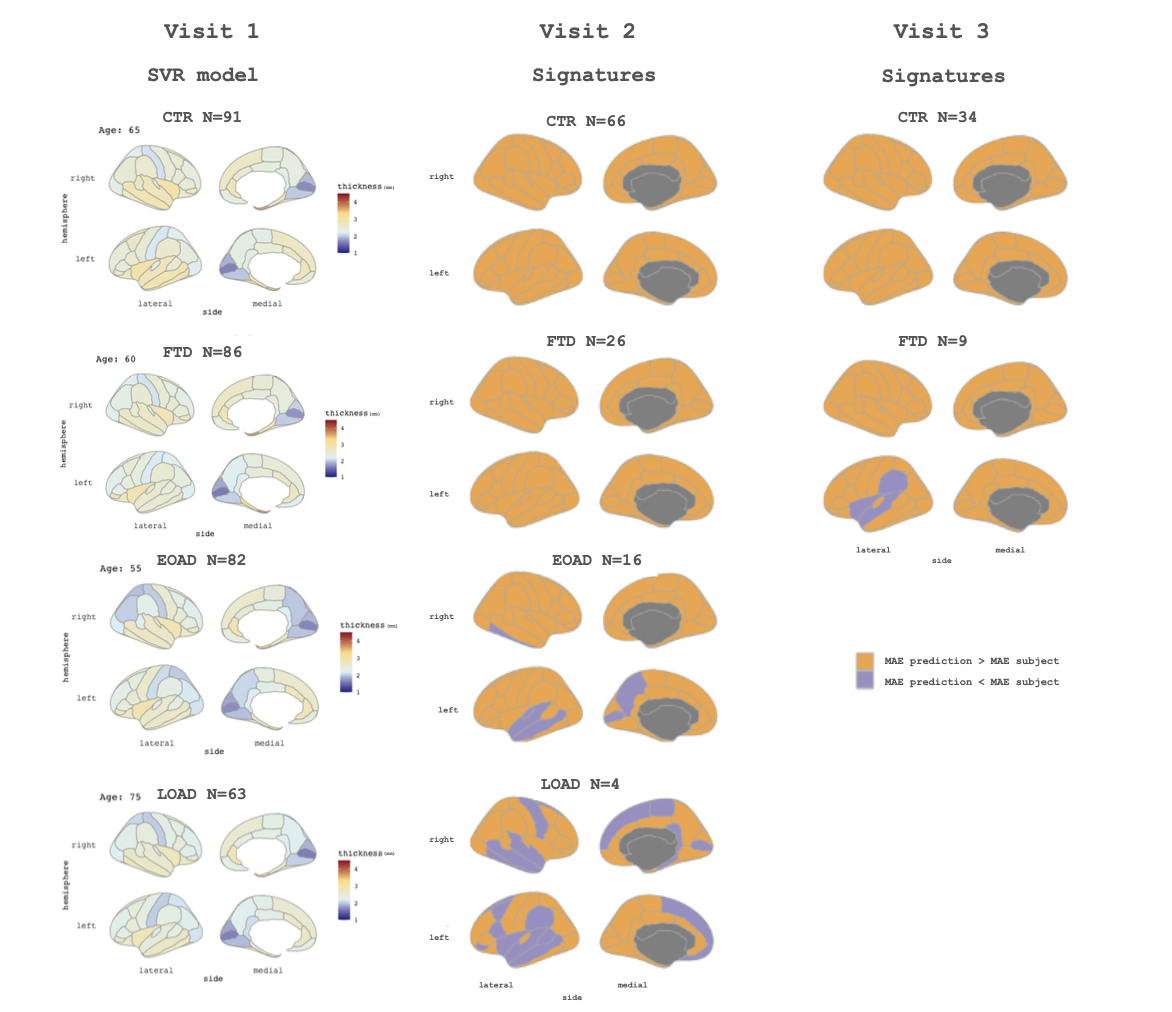
Results: CTh trajectories according to age estimated with our SVR framework for each group are shown in animated Figure 1. The overall RMSE for these predictions was 0.01 for CTR and 0.02 for FTD, EOAD and LOAD. We described individual and disease signatures comparing the MAE values (Figure 2): if longitudinal data was more alike to its corresponding baseline data than to the age-group predicted data, this region was marked as individual signature; otherwise, if longitudinal data was more similar to the age-group prediction, the region was labeled as disease signature. According to that, at visit 2, for CTR and FTD, all regions were identified as individual signature (mean across subjects). However, for EOAD and LOAD we identified some regions at which the longitudinal points were closer to their age-group prediction than to the corresponding baseline subject. For the visit 3, CTR remained with a dominance of individual characteristics, however, FTD patients showed some disease specific regions.
Conclusions:We modeled separated age trajectories for CTR, EOAD, LOAD and FTD. Our framework allows predicting CTh values according to age and disease-group, offering whole-brain cortical models of disease progression. By using the longitudinal data in a prediction setting, we first found that, in the absence of disease, the individual characteristics might prevail over the age-defined trajectories. However, in disease (specially in AD forms), we identified a set of regions with strong disease effects, namely the disease signature. We highlight the use of age and group specific trajectories to obtain predictions that could ultimately be used in clinical settings.